Risk Disclaimer
Trading futures, forex, and other financial instruments involves substantial risk of loss and is not suitable for every investor. Past performance is not indicative of future results. The content on this site is for educational purposes only and does not constitute financial advice. Always consult with a licensed financial advisor before making trading decisions.

VaderDan
Expert TraderProfessional trader specializing in Candle Range Theory (CRT), Wyckoff Method, and institutional order flow analysis. Helping traders master prop firm challenges and develop consistent trading strategies.
Point & Figure Counting Simplified: Predicting Price Targets Like Wyckoff
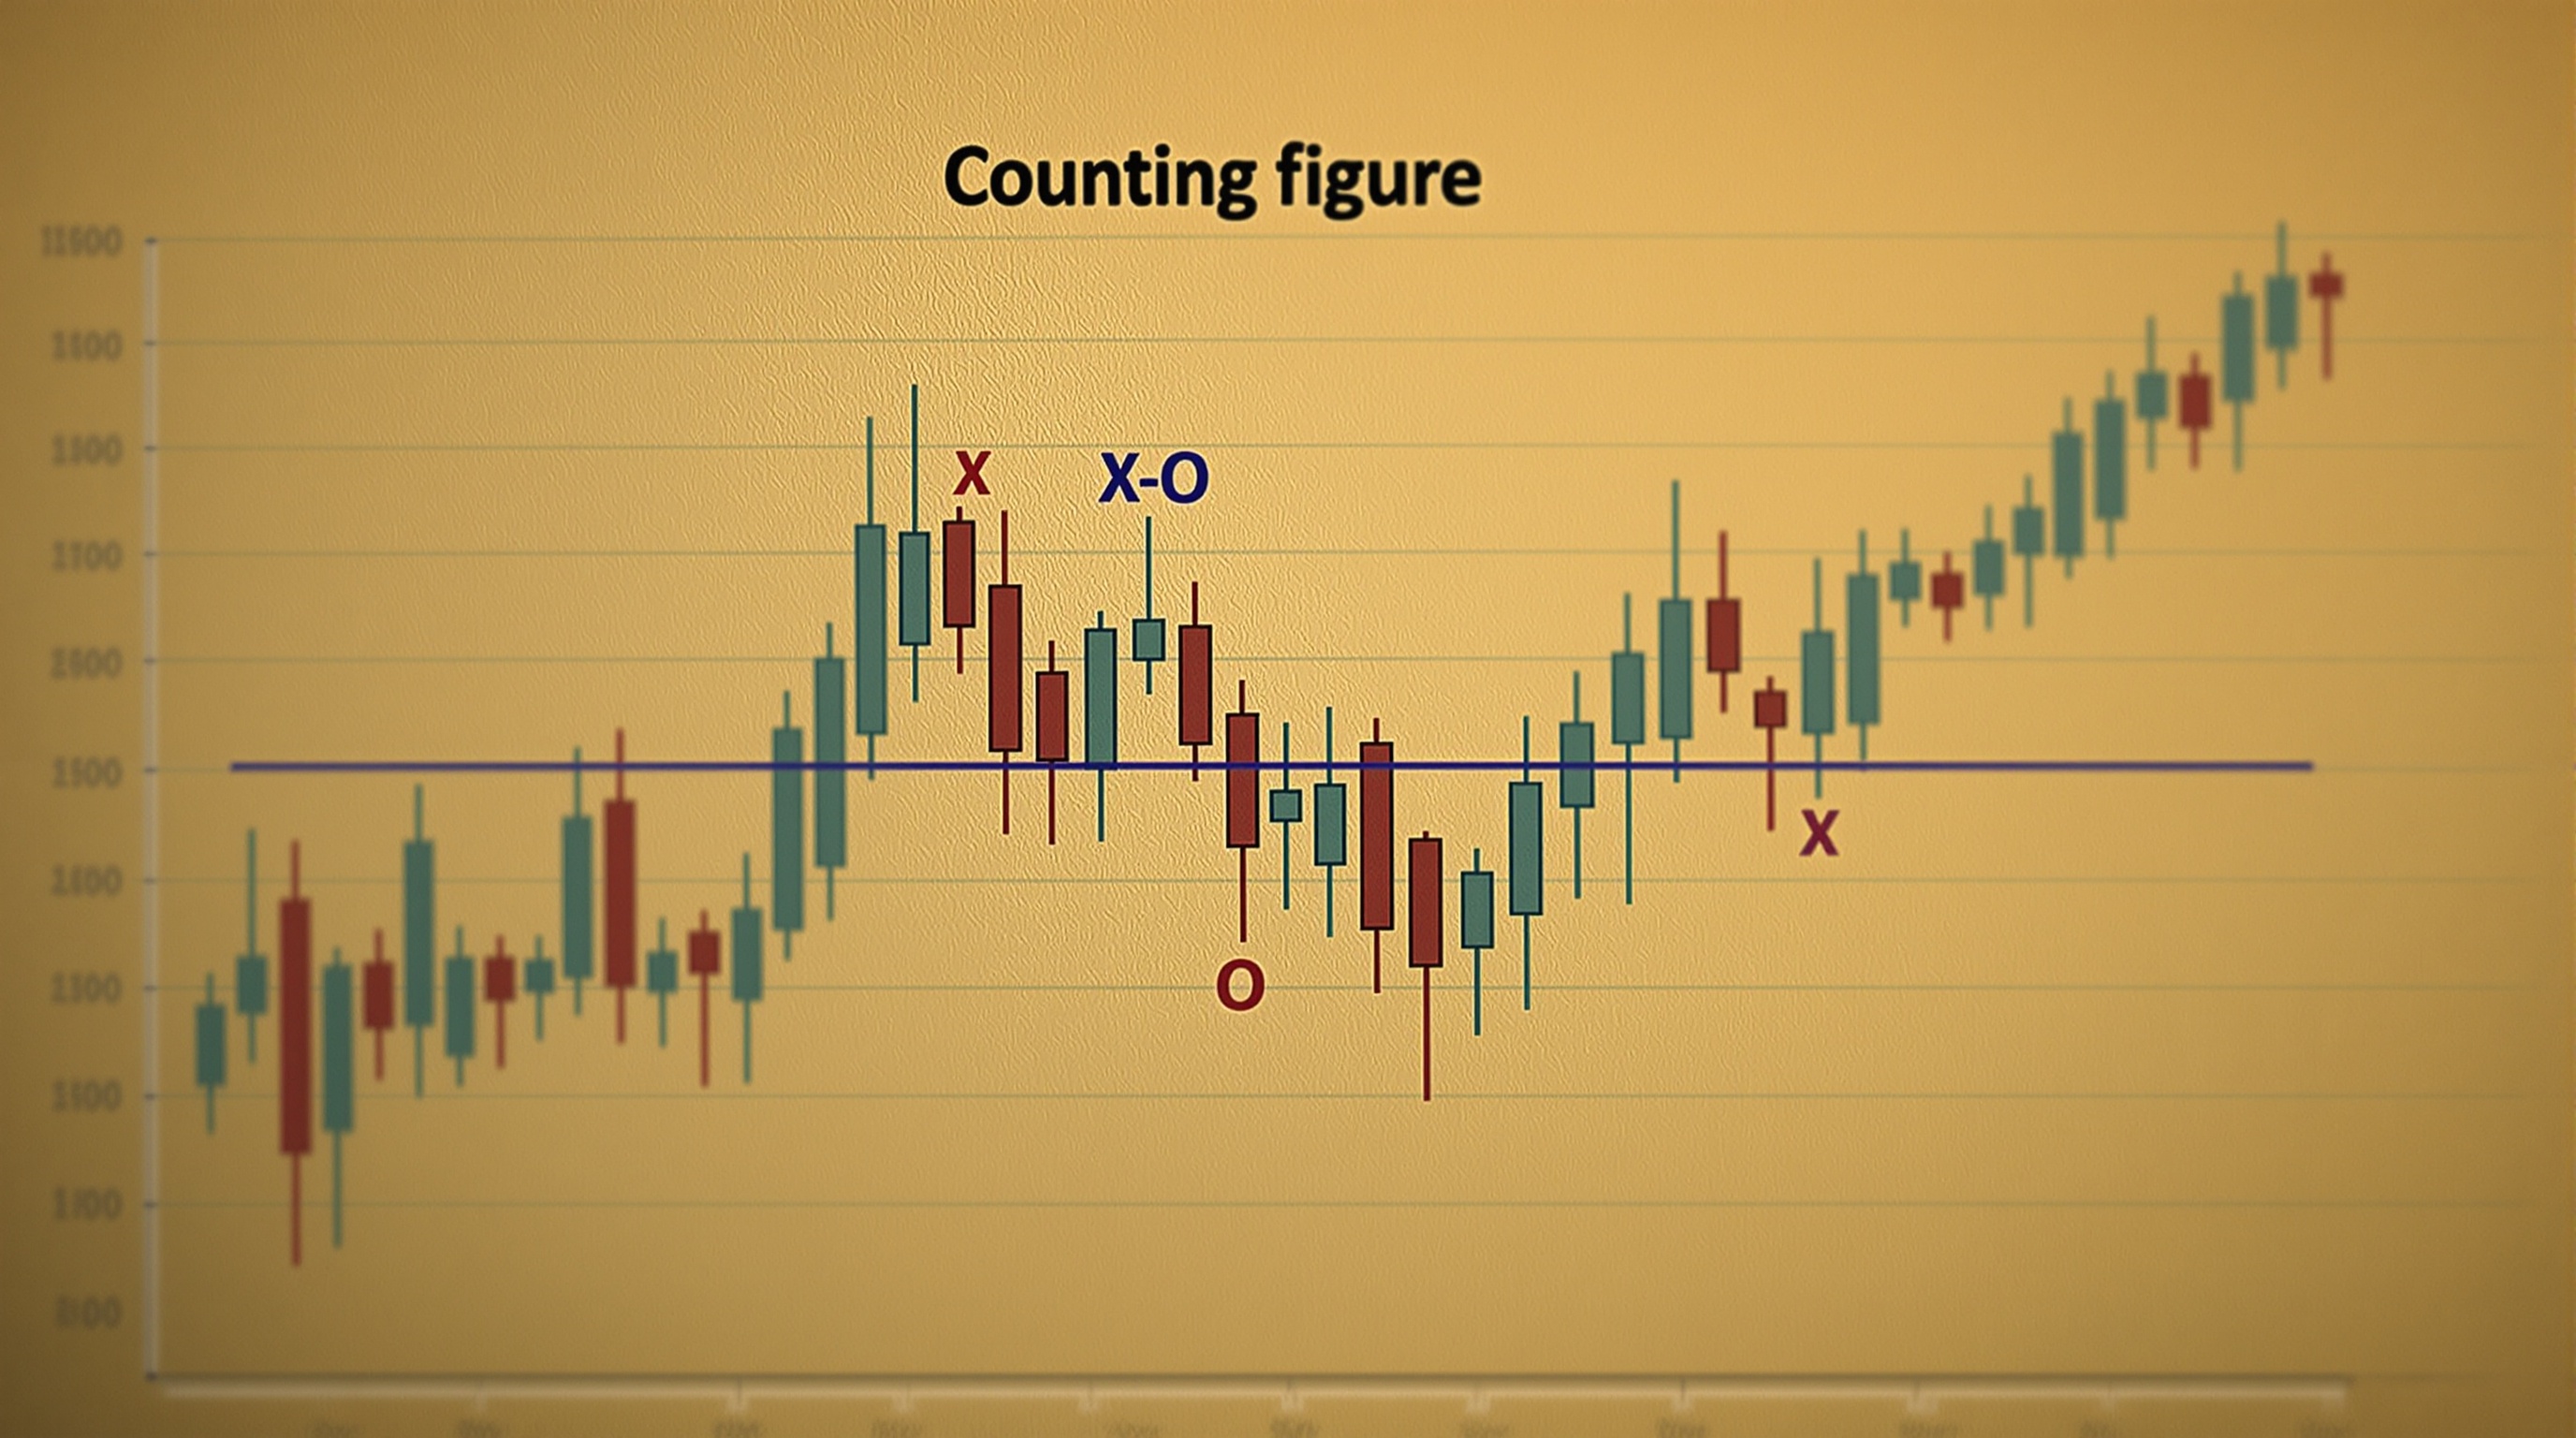
Want to know where price is headed? Point & Figure counting gives you objective price targets based on the size of accumulation or distribution. It's like measuring the fuel in the tank before the move.
What Is Point & Figure Counting?
Imagine you're measuring how far a rubber band will snap back after you stretch it. The more you stretch it, the farther it will fly back when released.
Point & Figure counting works the same way. It measures how much "energy" smart money has built up during accumulation or distribution phases, then calculates how far price is likely to move when that energy is released.
Key Principle: The longer and wider the accumulation/distribution phase, the bigger the subsequent price move will be.
Why Point & Figure Matters
Most traders guess at their profit targets. They might say "I'll take profits at the next resistance level" without any scientific basis. Point & Figure counting gives you:
- Realistic targets: Based on the actual "fuel" built up in the range
- Multiple target levels: Conservative, moderate, and aggressive targets
- Trade management: Know when to take profits and when to hold
- Risk assessment: Measure if the reward justifies the risk
The Simplified Counting Method
Traditional Point & Figure can be complex. Here's the simplified version that works for modern trading:
Step 1: Identify the Base
The "base" is your accumulation or distribution range. Measure:
- Width: Distance from support to resistance
- Time: How long price stayed in the range
- Activity: Number of times price tested the levels
Example: EUR/USD Accumulation Base
Support: 1.0800
Resistance: 1.0900
Width: 100 pips
Duration: 4 weeks
Tests: 6 support tests, 4 resistance tests
Step 2: Apply the Basic Count
Use this simplified formula:
Basic Target = Base Width × Count Factor
Conservative
Width × 1.0
Equal to base width
Moderate
Width × 1.5
1.5x base width
Aggressive
Width × 2.0
2x base width
Step 3: Calculate Your Targets
EUR/USD Target Calculation
- Range: 1.0800 - 1.0900 (100 pips wide)
- Breakout point: 1.0900 (resistance break)
- Direction: Bullish (accumulation completed)
- Conservative: 1.0900 + 100 pips = 1.1000
- Moderate: 1.0900 + 150 pips = 1.1050
- Aggressive: 1.0900 + 200 pips = 1.1100
Advanced Counting Factors
Adjust your count based on these factors:
Time Factor
- Quick ranges (1-2 weeks): Use 1.0x multiplier
- Normal ranges (3-6 weeks): Use 1.5x multiplier
- Extended ranges (7+ weeks): Use 2.0x or higher
Activity Factor
- Few tests (3-5): Standard multipliers
- Moderate tests (6-8): Add 0.2x to multipliers
- Many tests (9+): Add 0.5x to multipliers
Volume Factor
- Low volume range: Reduce targets by 25%
- Normal volume range: Use standard targets
- High volume range: Increase targets by 25%
Practical Trading Applications
Profit Taking Strategy
- 25% at Conservative target: Lock in guaranteed profits
- 50% at Moderate target: Take the majority of profits
- 25% at Aggressive target: Let runners capture extended moves
Stop Loss Positioning
Your stop loss should be:
- Accumulation trades: Below the spring low
- Distribution trades: Above the upthrust high
- Risk-reward check: Ensure conservative target gives minimum 2:1 ratio
Common Counting Scenarios
Scenario 1: Strong Accumulation
Setup: 6-week accumulation, high volume, multiple spring tests
Base width: 200 pips
Multiplier: 2.0x (extended time + high activity)
Conservative target: 200 pips
Aggressive target: 400 pips
Scenario 2: Quick Distribution
Setup: 2-week distribution, normal volume, few tests
Base width: 150 pips
Multiplier: 1.0x (quick range + low activity)
Conservative target: 150 pips down
Aggressive target: 150 pips down
Integration with Modern Tools
Combining with CRT
- Use P&F targets as: Final destinations for CRT trades
- CRT levels become: Profit-taking zones on the way to P&F targets
- Order blocks at P&F targets: Often provide excellent reversal points
Modern Timeframes
Adapt P&F counting to modern trading:
- Daily charts: For swing trading (multi-day holds)
- 4-hour charts: For day trading extensions
- 1-hour charts: For intraday scalping targets
Validation Techniques
Check Against Fibonacci
Your P&F targets should align reasonably with Fibonacci extensions:
- Conservative: Often near 127% extension
- Moderate: Often near 162% extension
- Aggressive: Often near 200% or 262% extension
Historical Analysis
Look at past similar ranges on the same instrument:
- Similar width ranges: How far did they typically move?
- Similar duration: What multipliers worked historically?
- Market conditions: Trending vs. ranging markets
Common Mistakes to Avoid
❌ Mechanical Application
Don't blindly apply formulas. Consider market conditions, news events, and overall trend strength.
❌ Ignoring Market Structure
If your target hits a major resistance level, expect price to struggle there regardless of the count.
❌ Unrealistic Expectations
P&F gives you probabilities, not guarantees. Market conditions can change and invalidate counts.
Key Takeaways
- ✓P&F counting measures the "energy" built up in accumulation/distribution phases
- ✓Use conservative (1x), moderate (1.5x), and aggressive (2x) multipliers
- ✓Adjust counts based on time, activity, and volume factors
- ✓Take profits in stages: 25% at conservative, 50% at moderate, 25% at aggressive
- ✓Validate targets against market structure and historical precedent
Complete Your Wyckoff Education
You now have all 6 simplified Wyckoff articles. Ready to explore the complete Wyckoff + CRT learning hub with additional resources?
Back to Wyckoff CRT Hub →